


 12 / 97

Unimed System Sustainability Report
12
CONTENTS INTRODUCTION GOVERNANCE AND MANAGEMENTECONOMIC HEALTH
SOCIAL HEALTH
ENVIRONMENTAL HEALTH
EXHIBITS
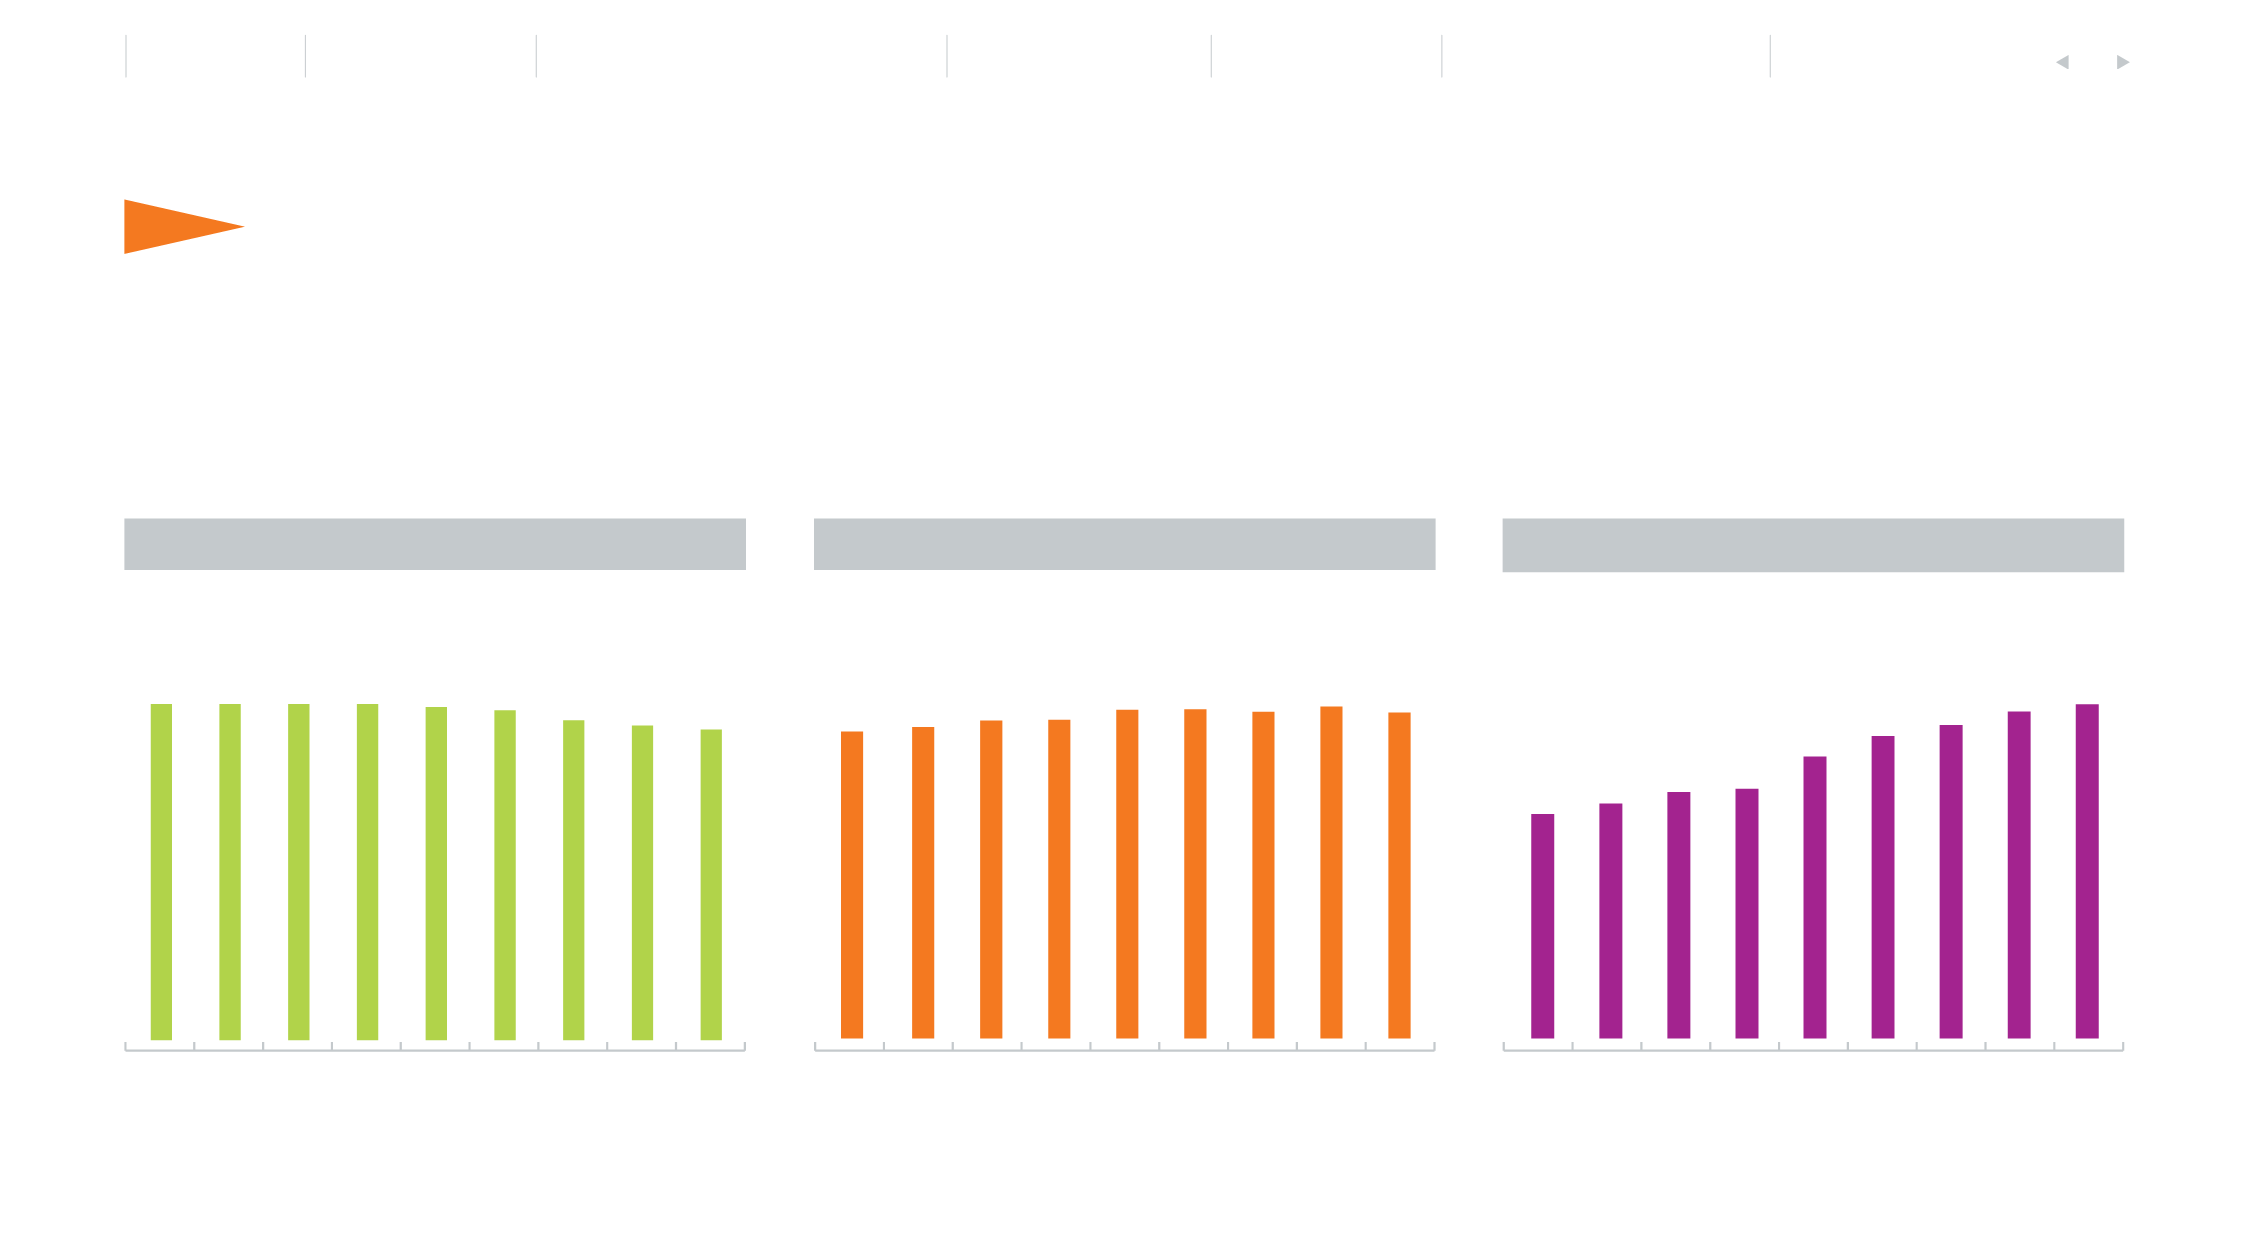
Along the years, Unimeds have been growing in number of beneficiaries and members, even if there be small recent oscillations. To keep the System sustainability and strengthen the
brand, we have noticed a natural reconfiguration of the System: Some Unimeds, referred to as Singulars, opted for joining; others ceased to act as health insurance operators and trans-
formed themselves in service providers, while others suffered intervention by the regulatory body and extinguished. This evolution in the number of Unimeds, active members and
beneficiaries is displayed in the graphics below.
Sustained growth
UNIMED NUMBER EVOLUTION
ACTIVE MEMBERS NUMBER EVOLUTION
BENEFICIARIES NUMBER EVOLUTION (INMILLION)
2006 2007 2008 2009 2010 2011 2012 2013 2014
2006 2007 2008 2009 2010 2011 2012 2013 2014
2006 2007 2008 2009 2010 2011 2012 2013 2014
376
376
376
376
373
370
360
355
351
103,670
105,030
106,870
107,130
110,020
110,170
109,450
111,020
109,240
14,209
14,758
15,356
15,528
17,211
18,286
18,858
19,567
19,953
Source: Unimed do Brasil – Cadu Application – Unimeds National Register, valid for December 2014.
Note: The total of beneficiaries does not comprise the Unimed Seguros details, as it is not a medical cooperative.